Trade the Edge.
Powered by AI.

Stop Guessing. Start Following a Data-Driven Trading System.

Analyze 7,000+ U.S. stocks and ETFs with AI-powered Long, Short, and No Position signals. Discover higher-conviction opportunities, build smarter portfolios, and know when your signals change.

  • 7,000+ U.S. stocks & ETFs analyzed daily
  • Clear Long, Short & No Position signals
  • Signal-change alerts for your portfolio
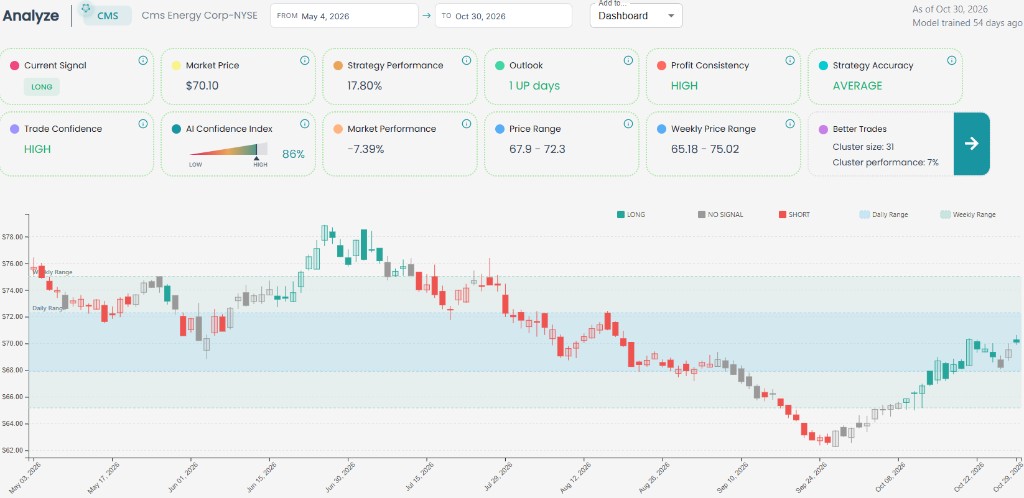
MarketSeer Analyze view for CMS Energy showing a Long signal, an 86% AI Confidence Index, performance metrics, and a chart of daily Long, Short and No Position signals
The real MarketSeer Analyze view for CMS Energy, as of Oct 30, 2026.
7,000+ U.S. stocks & ETFs
Long · Short · No Position
Refreshed every trading day
Full signal history, losses included
The Problem

Too Much Market Noise. Too Little Time.

Thousands of stocks, endless headlines, and indicators that rarely agree. Making consistent decisions by hand is hard, even for experienced traders.

Thousands of tickers

More than 7,000 U.S. stocks and ETFs trade every day. Nobody has time to evaluate them all, so most people never know where to start.

Conflicting information

Headlines, opinions, and indicators point in different directions. Without a system, every decision becomes a judgment call.

Inconsistent decisions

Knowing when to get in, when to get out, and when to stay on the sidelines is where most trades go wrong.

7,000+ U.S. stocks & ETFs analyzed every trading day
1 clear signal Long, Short, or No Position for every asset
A daily shortlist The higher-conviction opportunities worth your attention today
How It Works

From Market Noise to Actionable Opportunities

A simple, repeatable process: find an idea, evaluate it, build around it, and keep watching it.

1

Find Opportunities

Start with the daily Top Trades reports or search any of 7,000+ tickers. Model-identified trading opportunities are clearly tagged.

2

Evaluate Signals

Check the current signal (Long, Short, or No Position), its AI Confidence Index, and how the signal has performed over time.

3

Build a Portfolio

Turn ideas into a portfolio with AI-guided allocation weights, sector diversification, and stop-loss guidance.

4

Monitor Changes

MarketSeer re-evaluates your holdings every trading day and emails you when a signal changes.

The Product

See Exactly What You Get

No black box. Every asset has a full analysis page, every signal has a confidence score, and every call stays on the record.

Ticker Analysis

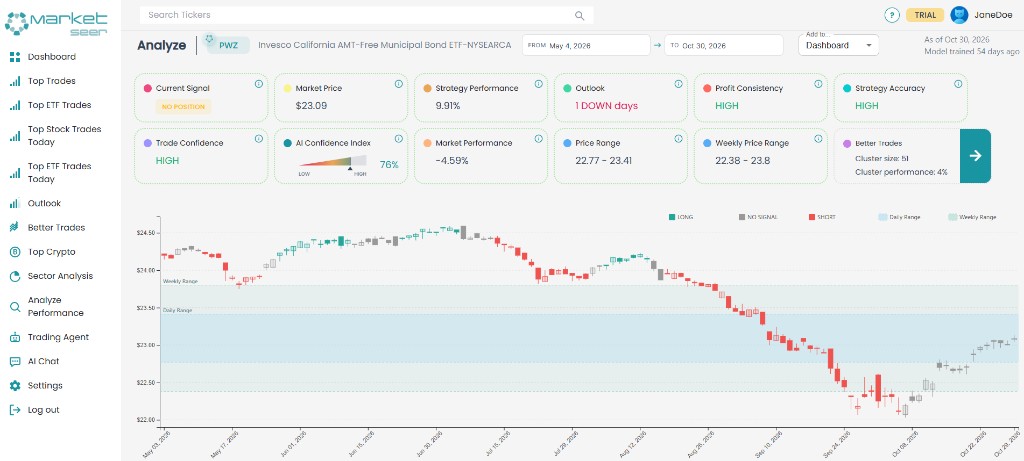
Every covered stock and ETF has its own analysis page, so you can understand a signal before you act on it.

  • Current signal and AI Confidence Index at a glance
  • Performance metrics and expected price ranges
  • A full chart of the signal's history
MarketSeer Analyze page for PWZ with the navigation menu of daily curated lists, signal and performance tiles, and a chart colored by daily Long, Short and No Position signals Portfolio dashboard cards for PAY, RUSHA, HAYW, CMS and CPRI showing price, daily change, Long or Short signal, and allocation weight

Also included

Sector Outlooks

Daily AI-generated outlooks across sectors show where opportunities are emerging.

Smarter Trade Alternatives

See higher-conviction alternatives when the model finds a stronger opportunity than your current pick.

Long & Short Outlooks

Higher-conviction long ideas and assets with elevated downside risk, across investment horizons.

Daily Curated Reports

Thousands of Stocks. A Shortlist of Opportunities Worth Watching. Updated Every Day.

MarketSeer analyzes current market conditions after every close and refreshes its top recommendation lists, so you always know where to start.

Not sure where to start? Start here.

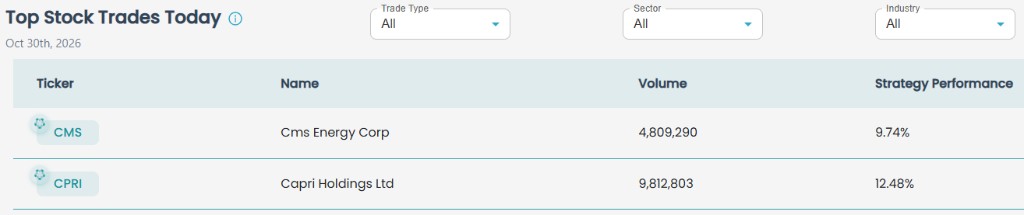
You don't need to search through 7,000 stocks. Each day's Top Trades lists show the opportunities the model currently rates highest, each with a clear signal you can click into.

  • Refreshed every trading day from fresh market data
  • Shortlisted by model conviction, with strategy performance for every pick
  • Filter by trade type, sector, and industry
  • One click from any idea to its full analysis and signal history
Updated daily
Top Stock Trades Today report for Oct 30, 2026 listing CMS Energy and Capri Holdings with volume and strategy performance

Every report, refreshed daily

Top Trades

A ranked selection of the platform's higher-conviction opportunities across all covered stocks and ETFs.

Top ETF Trades

The model's best ideas across exchange-traded funds, for diversified exposure.

Top Stocks Today

Near-term, time-sensitive single-stock opportunities for the current trading session.

Top ETF Trades Today

Near-term ETF opportunities ranked for immediate consideration.

Long Outlook

Higher-conviction long ideas across investment horizons.

Short Outlook

Assets showing elevated downside conviction across horizons.

Portfolio Management

AI-Guided Portfolio Builder

Turn signals into a portfolio you can actually manage. MarketSeer recommends how to weight each position, keeps you diversified, and tells you when something changes.

  • Allocation weights: recommended weights for every position in your portfolio
  • Sector diversification: see your exposure by sector and avoid concentrating in one corner of the market
  • Risk management: stop-loss guidance for each position
  • Signal-change alerts: an email whenever a holding's signal changes
Historical Transparency

Every Signal Has a History. Winners and Losers Included.

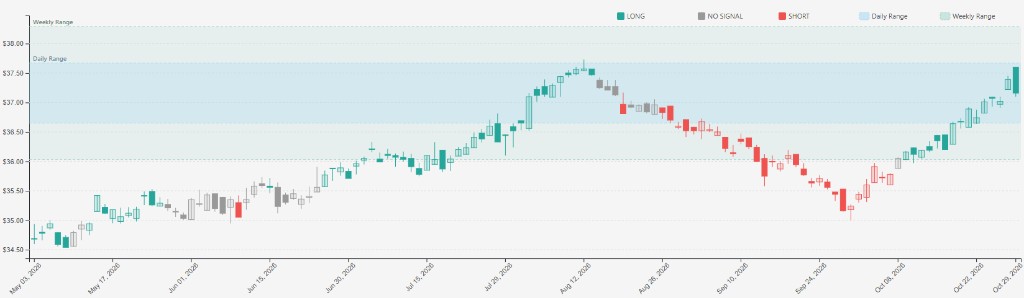
Most AI trading tools show you their best calls. MarketSeer keeps all of them. Every signal is recorded day by day, so you can judge the model on its full record.

Long Short No Position
Six months of daily candles for a covered stock, colored green during Long signals, red during Short signals, and grey during No Position Long through the July rally Short through the September decline
Daily signal history for one covered stock, May to October 2026. Each candle is colored by the signal that was active that day.

Timestamped calls

Every signal is recorded on the day it was issued.

Nothing gets deleted

Historical calls stay available for every covered asset.

See how signals evolved

Follow each change from Long to Short to No Position, day by day.

Losing calls included

Calls that didn't work out stay on the chart next to the ones that did.

A meaningful sample

Evaluate the model across thousands of assets and months of history, not a handful of cherry-picked winners.

How performance is measured

Strategy Performance
The result of following MarketSeer's signals over the selected date range.
Market Performance
The result of simply holding the asset over the same period, for comparison.
Strategy Accuracy
How often the signals called the direction correctly.
Profit Consistency
How steady the strategy's results have been over time.

Past performance is not indicative of future results.

Pricing

One plan. Full access.

Every signal, report, and portfolio tool on the platform. No tiers, no add-ons. Start with a free trial.

$ 999 / year

Billed annually (about $83/month) · Save $189 vs. monthly · Secure checkout by Stripe

  • Daily AI-powered trading signals
  • AI Confidence Index across covered assets
  • Top Trades and ETF reports
  • AI-guided portfolio builder
  • Portfolio allocation recommendations
  • Stock analysis and stop-loss guidance
  • Email alerts when portfolio signals change
  • Full historical signal records
Start Your Free Trial

Turn off auto-renew anytime from Settings.

FAQ

Frequently asked

Contact

Questions before you start?

We usually reply within one business day.

Contact Form

Get In Touch